What is a Fishbone Diagram?
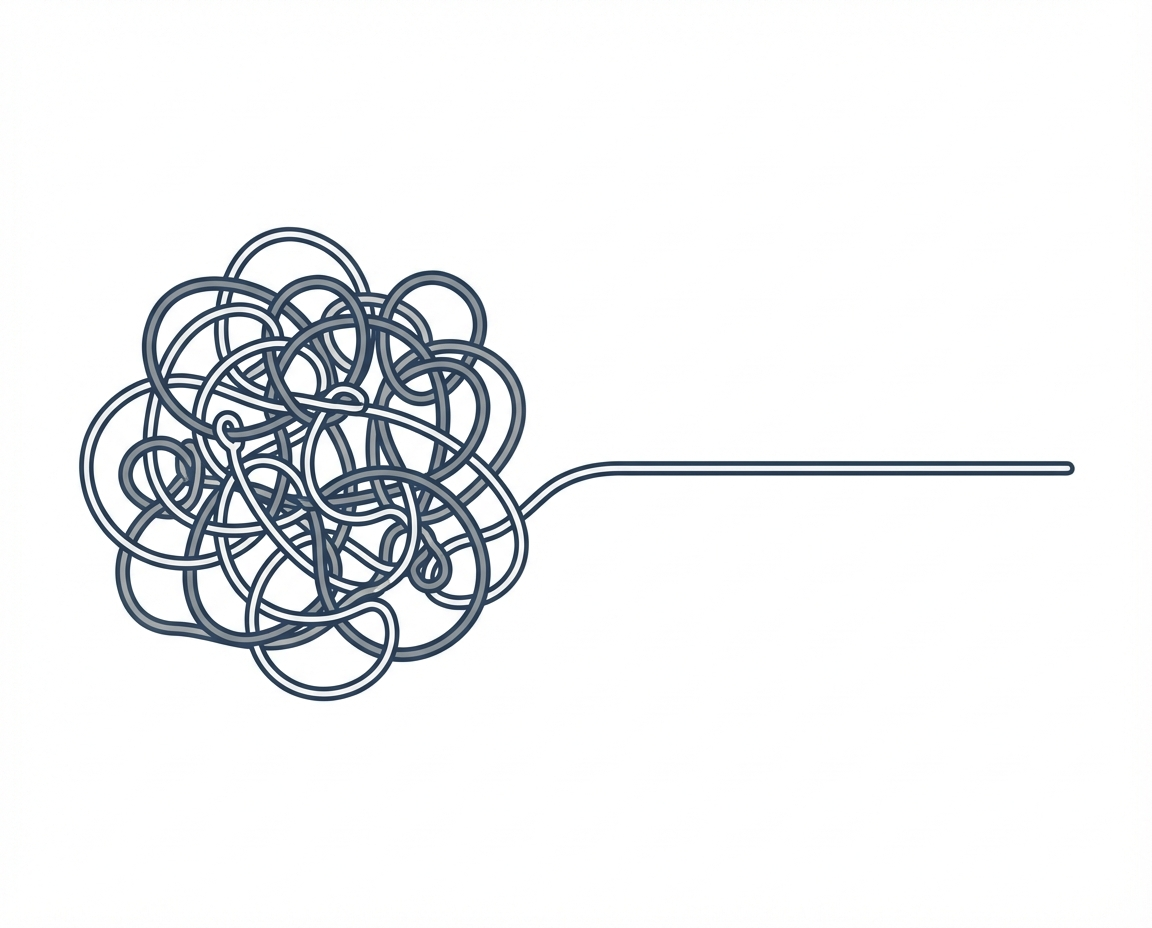
You have likely felt that sinking feeling when a problem in your business keeps coming back. You fixed the immediate symptom last month but the underlying issue remains today. It is exhausting to manage a team when you feel like you are just putting out fires. This constant cycle leads to stress and a lack of confidence in your own leadership. This is where a Fishbone Diagram becomes an essential tool for your management toolkit. It is a visual way to look at a problem and see every possible factor that contributed to it. Rather than making quick guesses you can look at the whole system.
Understanding the Fishbone Diagram
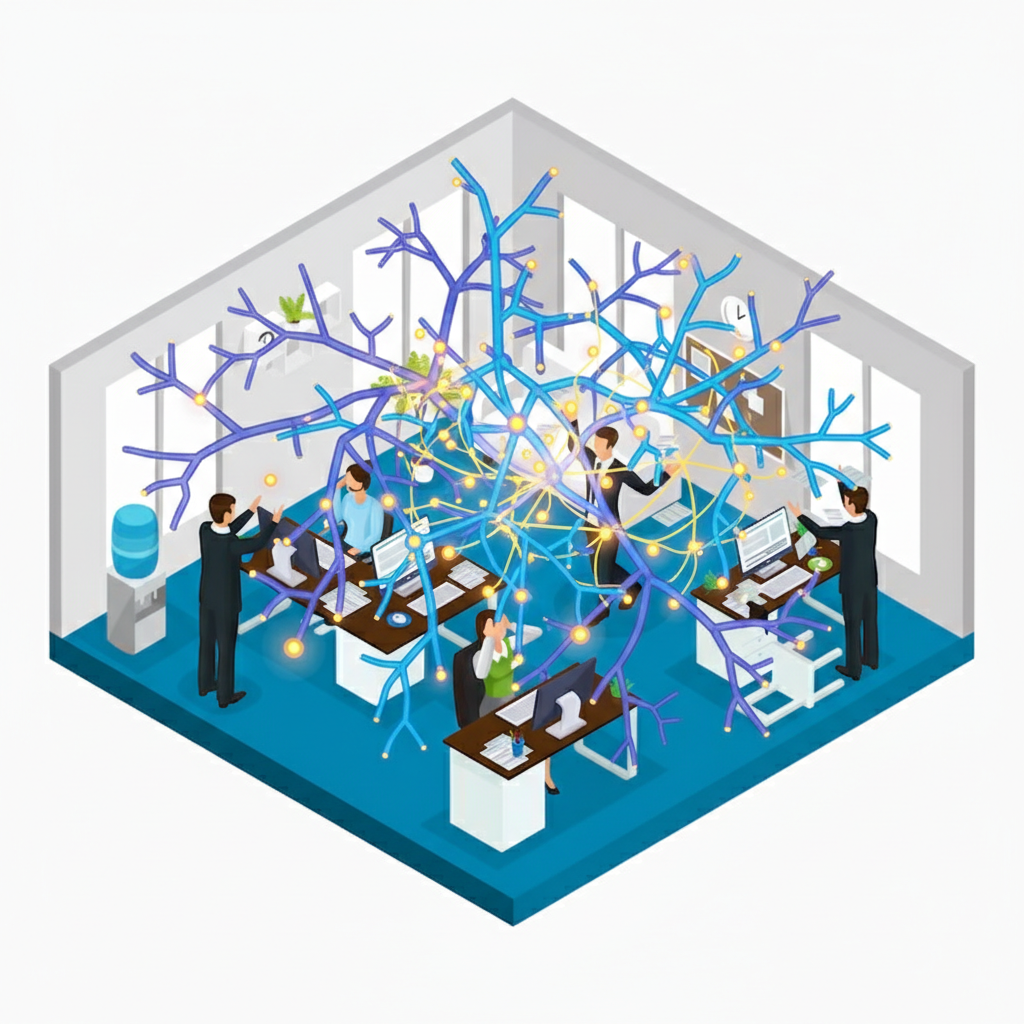
A Fishbone Diagram is a visualization tool used to help you categorize the potential causes of a problem. People often call it an Ishikawa diagram because it was created by Kaoru Ishikawa. The name comes from how the finished chart looks. The head of the fish represents the main problem you are trying to solve. The bones extending from the spine represent different categories of potential causes that contribute to that final result.
As a manager you use this tool when you need to move beyond intuition. It forces you and your team to stop looking for a single person to blame and instead look at the entire operation. It creates a space where you can be objective about why things are not working. This practice helps build trust because the focus remains on the process rather than personal failure.
Key Categories in the Fishbone Diagram
When you sit down with your team to build one of these you usually start with six standard categories. These help you organize your thoughts so you do not miss anything important during the brainstorm. Each category acts as a prompt to look into corners of the business you might otherwise ignore.
- Methods: These are the processes or rules you follow to get work done.
- Machines: This includes the tools, software, or physical hardware your team uses every day.
- Materials: This covers the raw information or physical components needed to complete a task.
- Measurements: This is the data you use to evaluate your success and how you collect it.
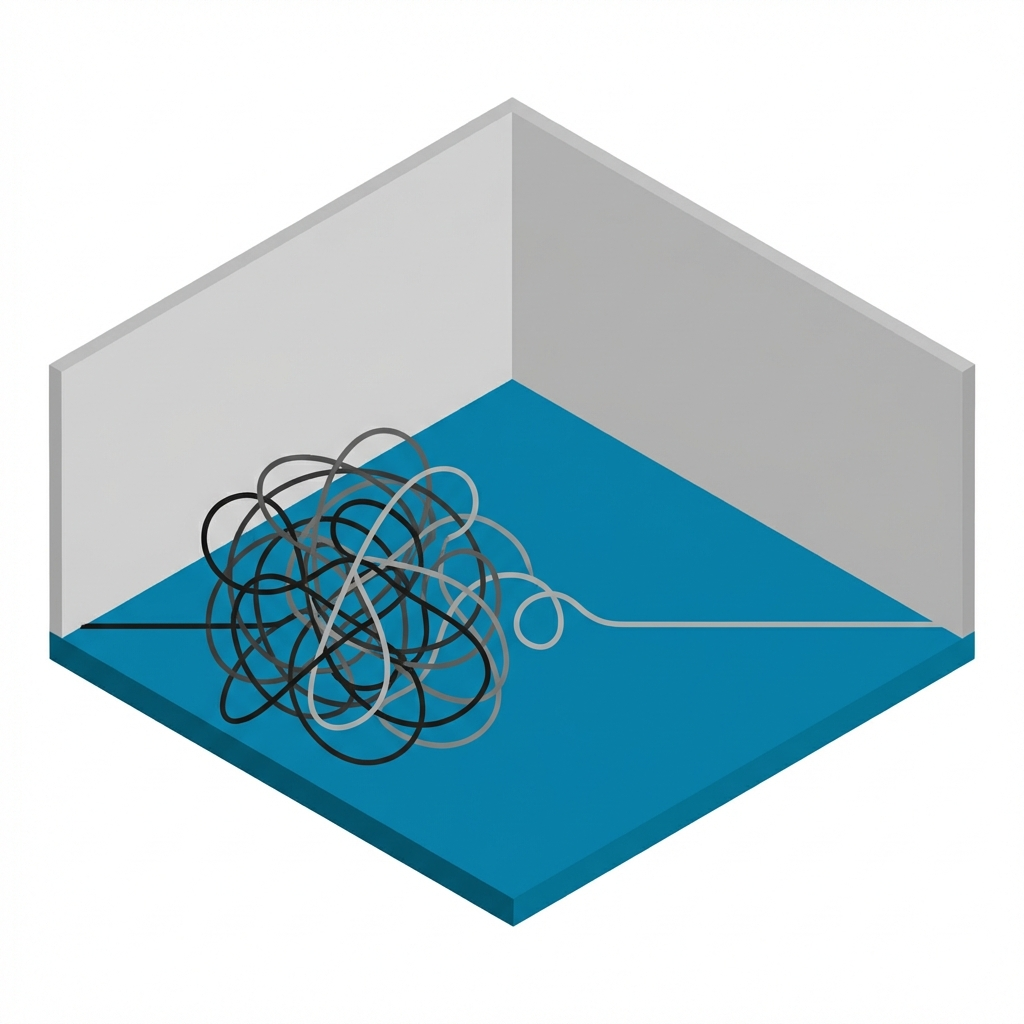
- Environment: This is the physical or digital space where the work happens.
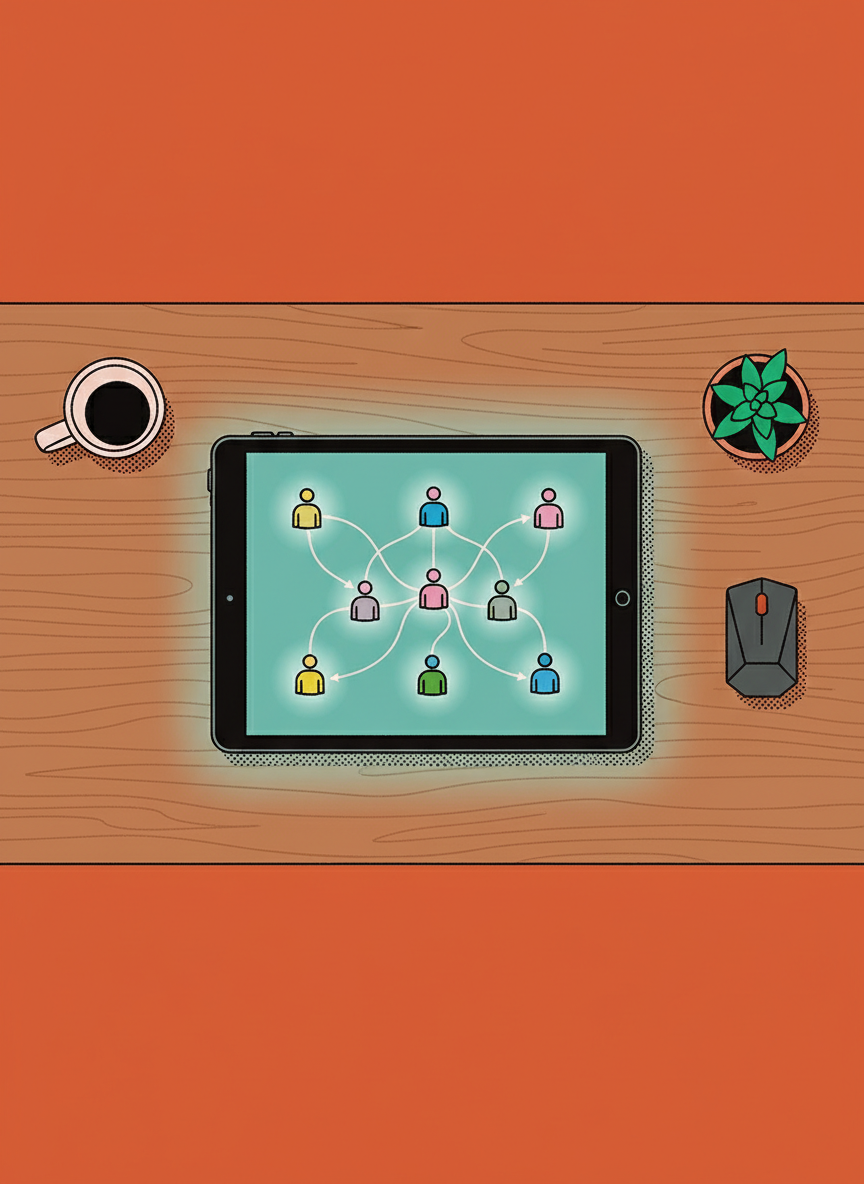
- People: This covers the staff involved and their specific skills or constraints.
By looking at each of these you can see where a breakdown might have happened. It helps you identify if the issue is a lack of training or perhaps a software glitch that no one noticed before. It turns a vague worry into a specific list of items to investigate.
Fishbone Diagram vs. The Five Whys
You might have heard of the Five Whys technique. It is another popular root cause analysis tool. While they both aim for the same goal they work differently. The Five Whys is a linear approach. You ask why something happened and then ask why to that answer several times. It is very effective for simple problems with a direct cause and effect.
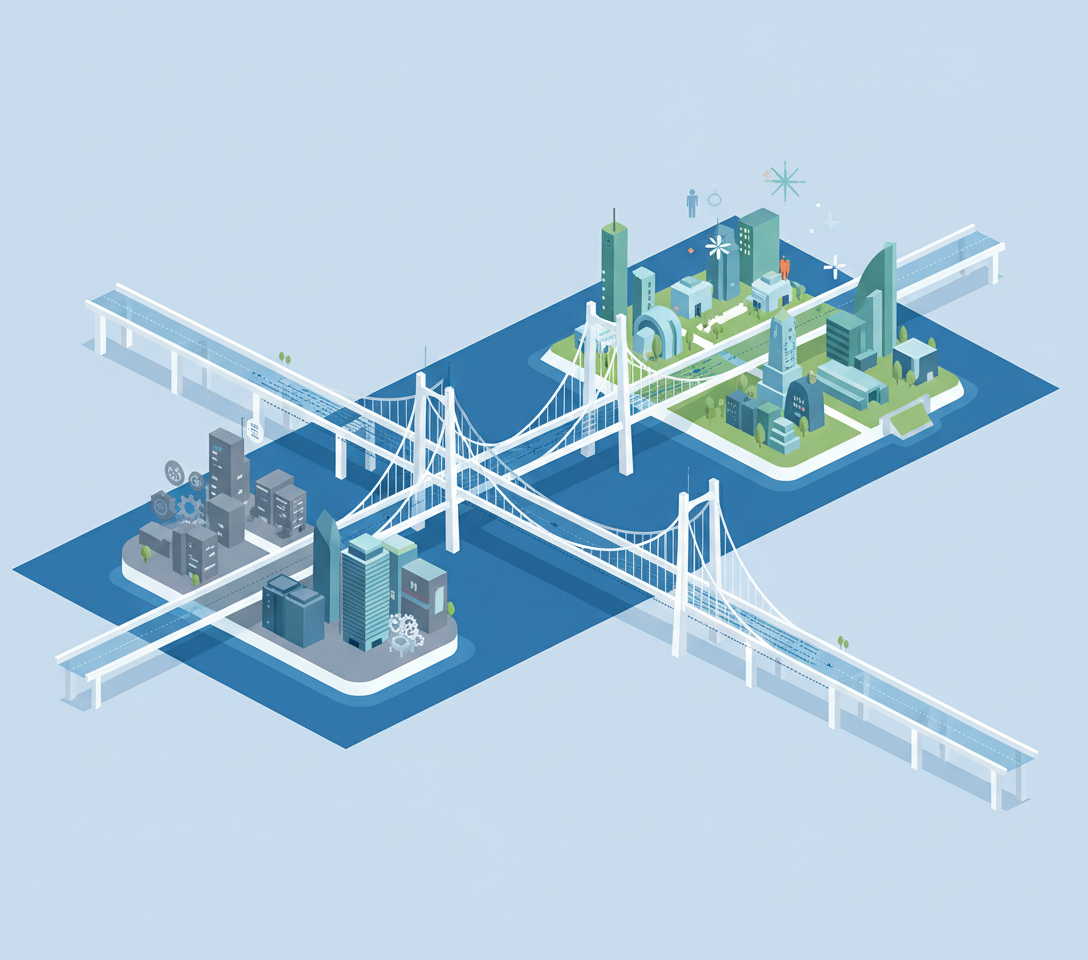
The Fishbone Diagram is better for complex issues where many things might be happening at once. A business owner facing high employee turnover likely has multiple factors at play. Using a diagram allows you to see the interconnectedness of these factors. It provides a broad view whereas the Five Whys provides a deep view into one specific path. Sometimes using both together can provide the most clarity for a manager.
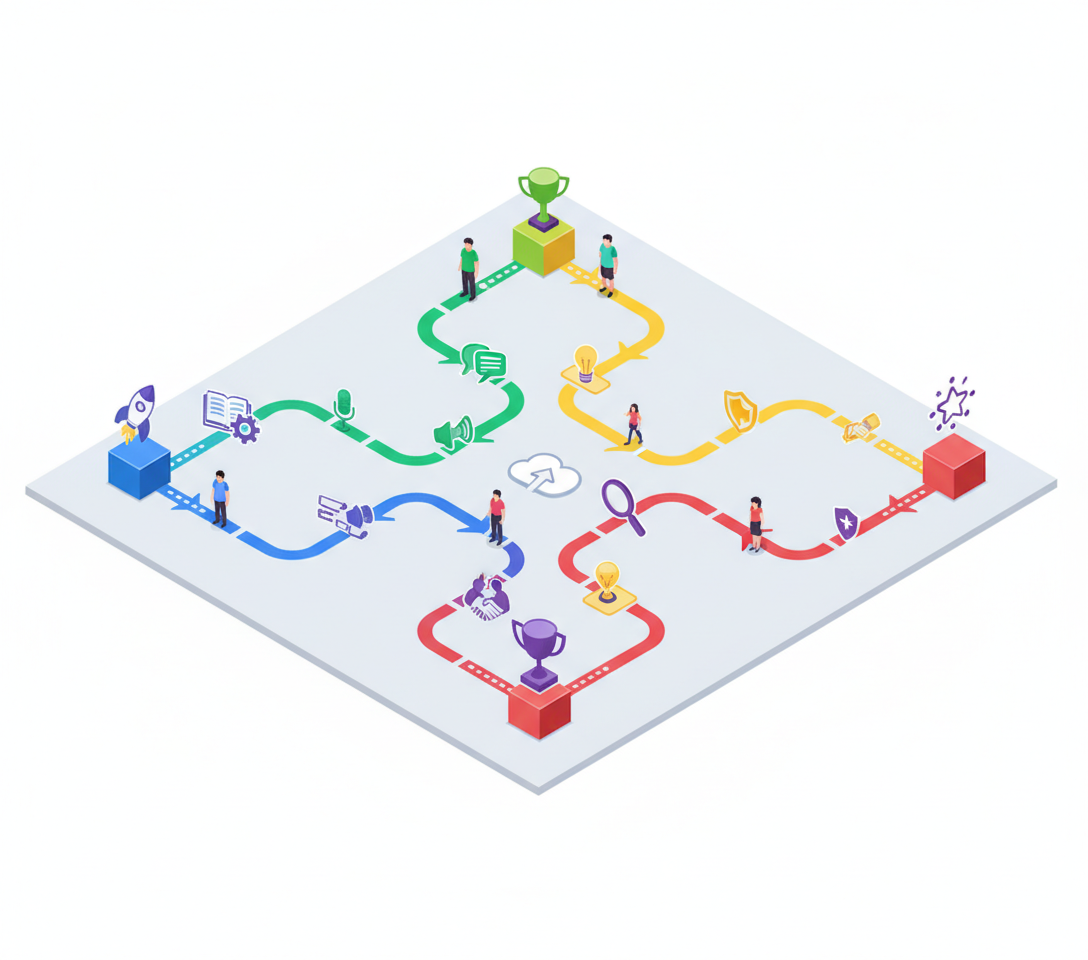
Scenarios for Using the Fishbone Diagram
There are specific moments in your journey as a manager where this tool shines. These are the times when the path forward feels the most uncertain and the stakes feel high for your team.
- When you launch a new product and the feedback is unexpectedly negative.
- When a loyal team begins to lose its motivation or productivity levels drop.
- When a recurring technical error disrupts your daily operations or customer experience.
- When you want to improve a process that currently feels clunky or slow.
In these moments bringing the team together to draw out the fishbone creates a sense of shared ownership. It moves the conversation from frustration to scientific investigation. You are no longer just a manager telling people what to do. You are a leader facilitating a discovery process that values everyone’s input.
Navigating the Unknowns in Problem Solving
Even with a perfect diagram there are things we still do not fully understand about organizational failure. How much does a person’s outside life truly affect the environment category? Can a digital tool ever truly account for the nuance of human emotion in a workplace? We can map out every process and measure every output but the human element remains a variable that is hard to pin down with a chart.
As you use this tool ask yourself if you are being honest about the categories. Are you avoiding the people category because it feels too personal? Are you ignoring the environment because you feel you cannot change it right now? Recognizing these gaps is part of the process of becoming a more confident and effective manager. The Fishbone Diagram is not a magic solution but it is a map that helps you navigate the complexity of your business with more steady hands.